Where grade
A–E comes from
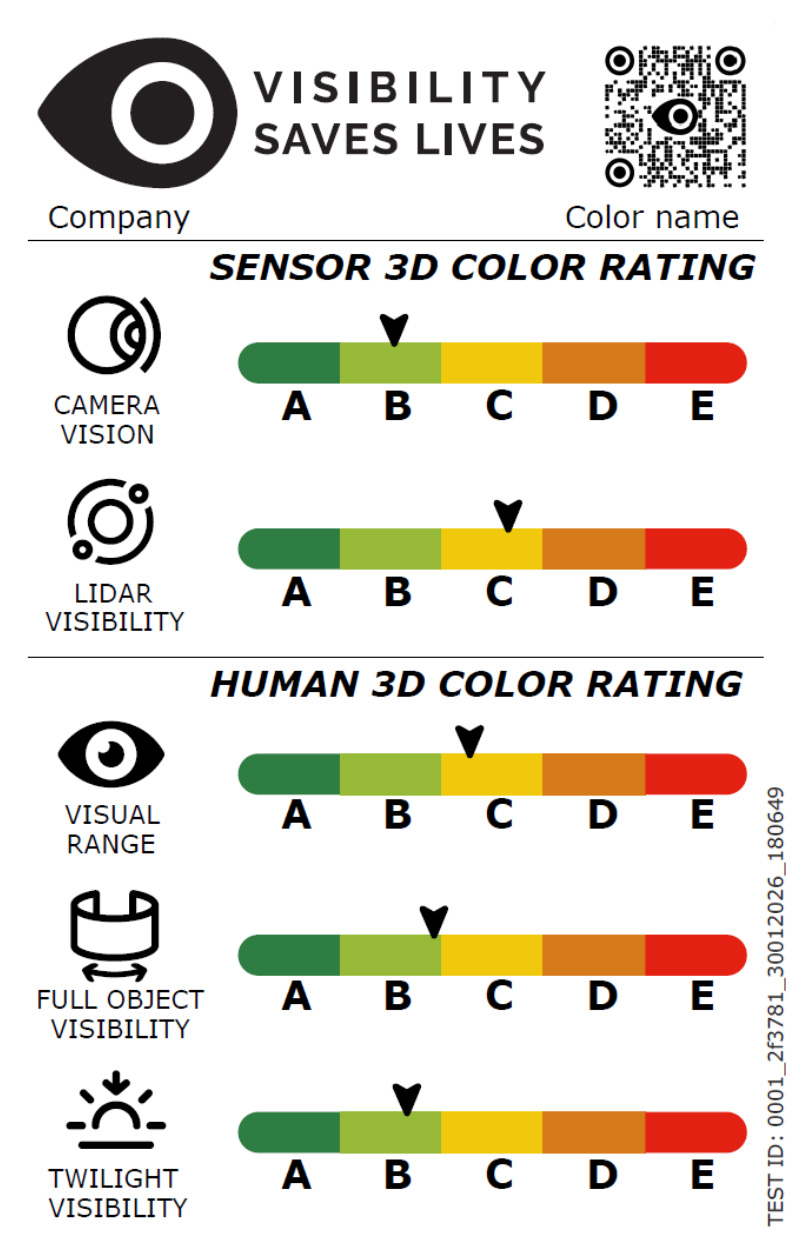
At night a coating either gets seen or it does not. The visibility label turns that into one letter from A to E [1], measured rather than claimed. Because every sample is measured beside a white reference, whatever the instrument itself adds cancels out, so two coatings measured months apart can still be compared and the letter is something someone else can check. Below are the six steps, run once for each of the five parameters.
Capture
The sample is photographed at five viewing angles, under three light levels, by two cameras: one RGB and one 905 nm LiDAR camera. Each frame is averaged over about 15 000 pixels.
Sensor counts to light
The raw camera counts are cleaned of sensor noise and balanced against the white reference. Nothing is added to make the picture look nicer, so every number stays in step with the light the sample actually returned.
Colour to brightness
The three colour channels (RGB) are combined into the one brightness an eye would see. In bright light that is the usual mix; in dim light the eye leans toward blue, and the weighting follows it.
100 lx|near photopic|Y = 0.1997 R + 0.6928 G + 0.1075 B
1000 lx|photopic|Y = 0.2126 R + 0.7152 G + 0.0722 B
Five angles to one number
Each angle stands for an equal-width ring of the flattened hemisphere, so each ring measurement is weighted by the surface area of its ring rather than counted equally. The inner ring is nearly a mirror of the lamp rather than the colour a driver sees, which is why some parameters leave it out.
Compare to the glossy white reference
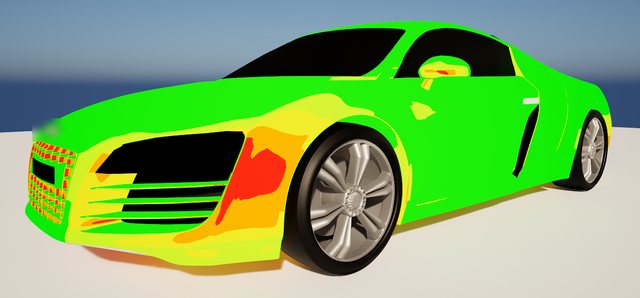
A glossy white reference panel is measured the same way, at the same angles and light levels. The sample is divided by the white, so whatever the lamp and camera contribute appears on both sides and cancels. What is left is how bright the sample is compared with white.
Grade
At night a coating has to be seen twice: by the driver of a vehicle, and by the cameras and LiDAR of the cars around it. Three grades follow a human eye. Camera Vision follows a vehicle camera, and LiDAR follows the 905 nm return. All five are measured against the same white reference and graded on the same scale.
Every grade also has a floor. Below it the answer is not a worse letter but ND = Not Detectable. For the human eye grades the floors are based on published contrast levels [2–5]: 1% of white at 100 lx, and 2% at 3 lx, where the contrast an eye needs roughly doubles [6]. Camera Vision and LiDAR have their own minimums, 0.3% and 0.6%. Above the floor, the ratio lands on a scale of six exponential steps (E to A+).
From the white reference down to a black coating is a lightness difference of 400:1, which no single exposure measures well.
| Tone | Share of white | Exposure boost |
|---|---|---|
| t1 | 0.85 and above | ×1 |
| t2 | 0.55 to 0.85 | ×1 |
| t3 | 0.31 to 0.55 | ×1 |
| t4 | 0.14 to 0.31 | ×1.6 |
| t5 | 0.049 to 0.14 | ×3.5 |
| t6 | 0.019 to 0.049 | ×10.2 |
| t7 | below 0.019 | ×26.7 |
A black coating sends back about 1/400 of white's light. An exposure set for white leaves black lost in sensor noise; one set for black overflows on white. So each panel is first sorted into a tone, with one quick reading against white, and darker tones get more exposure; the last column shows how much more than t1. The band edges follow the grey steps of a reference card, measured on a V-Lab Tabletop. Before the sample is compared with white, the boost is divided out again: it helps a dark panel be read cleanly, and plays no part in the comparison.
From 1000 lx down to 3 lx, and to an adapted eye white still looks a third as bright.
| Light | Share of light | Brightness | Colourfulness |
|---|---|---|---|
| 1000 lx | 1 | 1.00 | 1.00 |
| 100 lx | 1/10 | 0.63 | 0.83 |
| 3 lx | 1/333 | 0.31 | 0.62 |
The grades are measured; the images show the panels close to how a human eye would see them under the set light conditions, once adapted to them. Taken at the same exposure, the 3 lx image would be nearly black, but an eye adapted to that light does not see it so: to that eye white still looks about a third as bright, and colours fade. So each image is rendered for an adapted observer with CIECAM02 [7], using the brightness and colourfulness in the table: the 3 lx image keeps about 60 percent of its saturation, the 100 lx one about 80. Every image is balanced to the white reference read under its own light, so white stays white and colours can be compared across all three. One effect is left out on purpose: at 3 lx the eye shifts toward blue, and that shift is applied in the grades, following mesopic photometry [8], not in the images.
One label carries five parameters, each reading the same frames differently.
| Parameter | Light | Rings | Reads |
|---|---|---|---|
| Camera Vision | 3 + 100 lx | 100% | mean RGB |
| LiDAR | 905 nm | 100% | return |
| Visual Range | 100 lx | 100% | human |
| Full Object | 3 + 100 lx | 84% | human |
| Twilight | 3 lx | 96% | human |
The Rings column shows which of the five rings from step 04 a parameter uses: 100% means all five. The outer rings carry the shape: they are the surfaces that curve away and show a vehicle's 3D form. The centre ring, read at 6°, mostly mirrors the lamp back and disturbs that shape information at twilight, so Twilight leaves it out and keeps 96%. Full Object goes one ring further, leaving out 18° as well, and keeps 84%: the steeper surfaces that make up most of a vehicle's visible 3D shape.
Seven exponential steps between “E”-Black (0) and “A”-White (1).
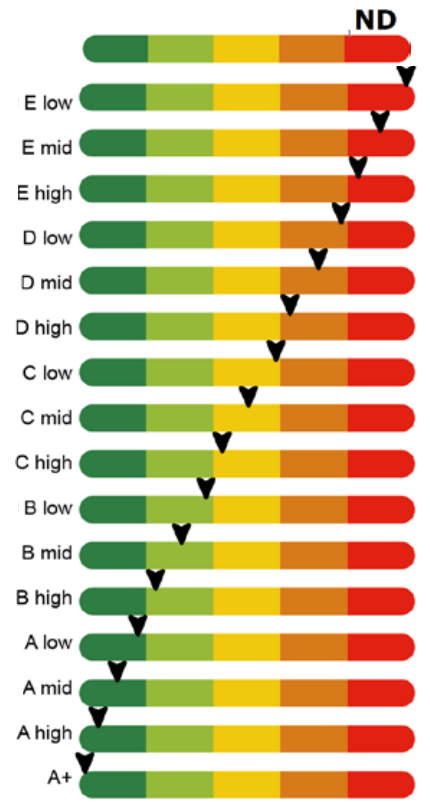
A measured blue at 3 lx. Step 3 has already run, so these are brightness values.
| Angle | White | Sample | Weight |
|---|---|---|---|
| 6° | 0.2447 | 0.0855 | dropped |
| 18° | 0.2387 | 0.0460 | 12 |
| 30° | 0.2242 | 0.0281 | 20 |
| 44° | 0.1938 | 0.0180 | 28 |
| 64° | 0.1243 | 0.0080 | 36 |
Dropped means measured but not counted. Twilight reads 96% of the rings, and 6° is the one left out. Its weight of 4 leaves the sum, so 12 + 20 + 28 + 36 = 96.
white 17.247 / 100 = 0.17247
ratio 0.01906 / 0.17247 = 0.1105
- Mijnen & Moerenburg, A 3D Visibility Label for Mobility Coatings: Enhancing Traffic Safety through Color and Sensor Perception, SAE Int. J. of CAV 9(2), 2026
- Blackwell, Contrast thresholds of the human eye, J. Opt. Soc. Am. 36(11), 1946
- Campbell & Robson, Application of Fourier analysis to the visibility of gratings, J. Physiol. 197, 1968
- Barten, Contrast Sensitivity of the Human Eye and Its Effects on Image Quality, SPIE Press, 1999
- ISO 9241-303:2011, Ergonomics of human-system interaction, Part 303: Requirements for electronic visual displays
- Adrian, Visibility of targets: model for calculation, Lighting Res. Technol. 21(4), 1989
- CIE 159:2004, A colour appearance model for colour management systems: CIECAM02
- CIE 191:2010, Recommended system for mesopic photometry based on visual performance
What is the visibility of your mobility colours?
Measure your colours